Glucocorticoid Receptor (GR) Pathway Products
Introduction
SwitchGear Genomics offers a panel of 88 transfection-ready reporter constructs to allow you to measure Glucocorticoid Receptor (GR) pathway activation. The SwitchGear GR promoter targets were picked from our genome-wide promoter collection based on sequence motif analysis, expression studies, and transcription factor binding data. We conducted experiments to generate a profile across the set of constructs with and without GR activation. These data are summarized in the heatmap below. SwitchGear offers the complete pathway profiling panel of constructs in a plate format that allows you to characterize the effects of many conditions across the entire GR pathway. We also offer a smaller subset of key responder constructs that show a strong induction response and can be used as biomarkers in screening applications.
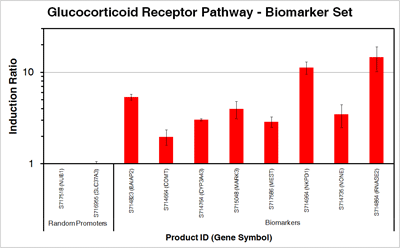
Glucocorticoid Receptor Biomarker Set - 8 promoters, 2 controls
 The selected constructs shown in the graph are the 8 of the highest responding promoters under our chosen test conditions*. The chart summarizes the induction ratios for each construct in HT1080 human fibrosarcoma cells that were transfected with promoter-reporter constructs and then treated with 100nM dexamethasone or vehicle only. The Y-axis shows the treated/untreated signal ratio on a log scale and error bars represent one standard deviation. Please see the heatmap below for relative promoter activities in an untreated setting.
Glucocorticoid Receptor Profiling Plate
 Click on the image for a larger view and then utilize the zoom tool in your browser window.
The selected constructs (as shown in the heatmap) represent the SwitchGear Glucocorticoid Receptor Profiling Plate. The heatmap summarizes the untreated activity and induction response for each construct in the pathway profiling plate using one common induction strategy (see above)*. On the right side of the figure, the colors represent log2 transformed ratios of treated/untreated activity according to the color scale shown at the base of the heatmap. Black indicates no change, and intensity of red or blue indicates levels of induction or repression, respectively. On the left side, the intensity of yellow parallels the activity of the promoter in the unstimulated or untreated condition. All untreated signals are relative to the highest and lowest values within the individual experiment. (“DEX”= HT1080 fibrosarcoma cells treated with 100 nM dexamethasone for 4 hours; “PRED”= HT1080 fibrosarcoma cells treated with 1 uM prednisone for 4 hours; “CORT”= HT1080 fibrosarcoma cells treated with 1 uM cortisone for 4 hours).
*Experimental results and absolute values of luciferase units may vary depending on cell line, treatment, and protocols. The data should be used as a guide for selecting candidate promoters and panels for your particular experimental design.
